

The short answer
A newly published study connected hundreds of circulating proteins to insulin sensitivity and built a 13-protein model for studying metabolic health. The real story is bigger—and more interesting—than a single blood-test headline.
Two people visit their doctors. Their blood-glucose results are similar. Their HbA1c values—the laboratory measure that reflects average blood glucose over the preceding few months—also look similar. It would be tempting to assume their bodies respond to insulin in roughly the same way.
But they might not.
Insulin sensitivity is not the same thing as blood glucose concentration. The body can sometimes maintain glucose levels by releasing more insulin. Meanwhile, skeletal muscle, the liver, adipose tissue, and immune cells may be taking part in very different metabolic conversations.
Now imagine a blood sample that carries traces of those conversations: proteins associated with tissue biology, inflammation, fat storage, and the body's response to insulin. Could scientists read that molecular pattern to learn something that glucose and cholesterol measurements alone don't reveal?
A study published November 16, 2026, in Nature Metabolism brings that question into unusually sharp focus. Jeppe Kjærgaard, Nigel Kurgan, Justus F. Gräf, and their colleagues combined deep plasma-protein profiling with direct measurements of insulin sensitivity. They identified 488 circulating proteins associated with insulin sensitivity, found that some of those protein patterns changed after exercise, and developed a model using 13 proteins plus three clinical measurements to estimate insulin sensitivity in people who had not undergone an intensive laboratory test. [1]
This is not a new diagnostic blood test ready for routine appointments. It is an important molecular research framework—and a glimpse of how preventive medicine might eventually move beyond a handful of measurements toward a more detailed picture of metabolic health.
The short answer
- What was discovered? Researchers profiled blood proteins from 161 participants across three cohorts assessed with the hyperinsulinaemic–euglycaemic clamp, a reference-standard research procedure for measuring insulin sensitivity. They identified 488 protein associations in the discovery analysis, with 62 remaining significant after wider adjustment for age, sex, and body fat. [1]
- What changed with exercise? In 43 men taking part in an eight-week high-intensity interval training intervention, insulin sensitivity improved by about 30–40%, and 22 circulating proteins showed statistically significant changes. The broader signature also shifted in a direction associated with better insulin sensitivity. [1]
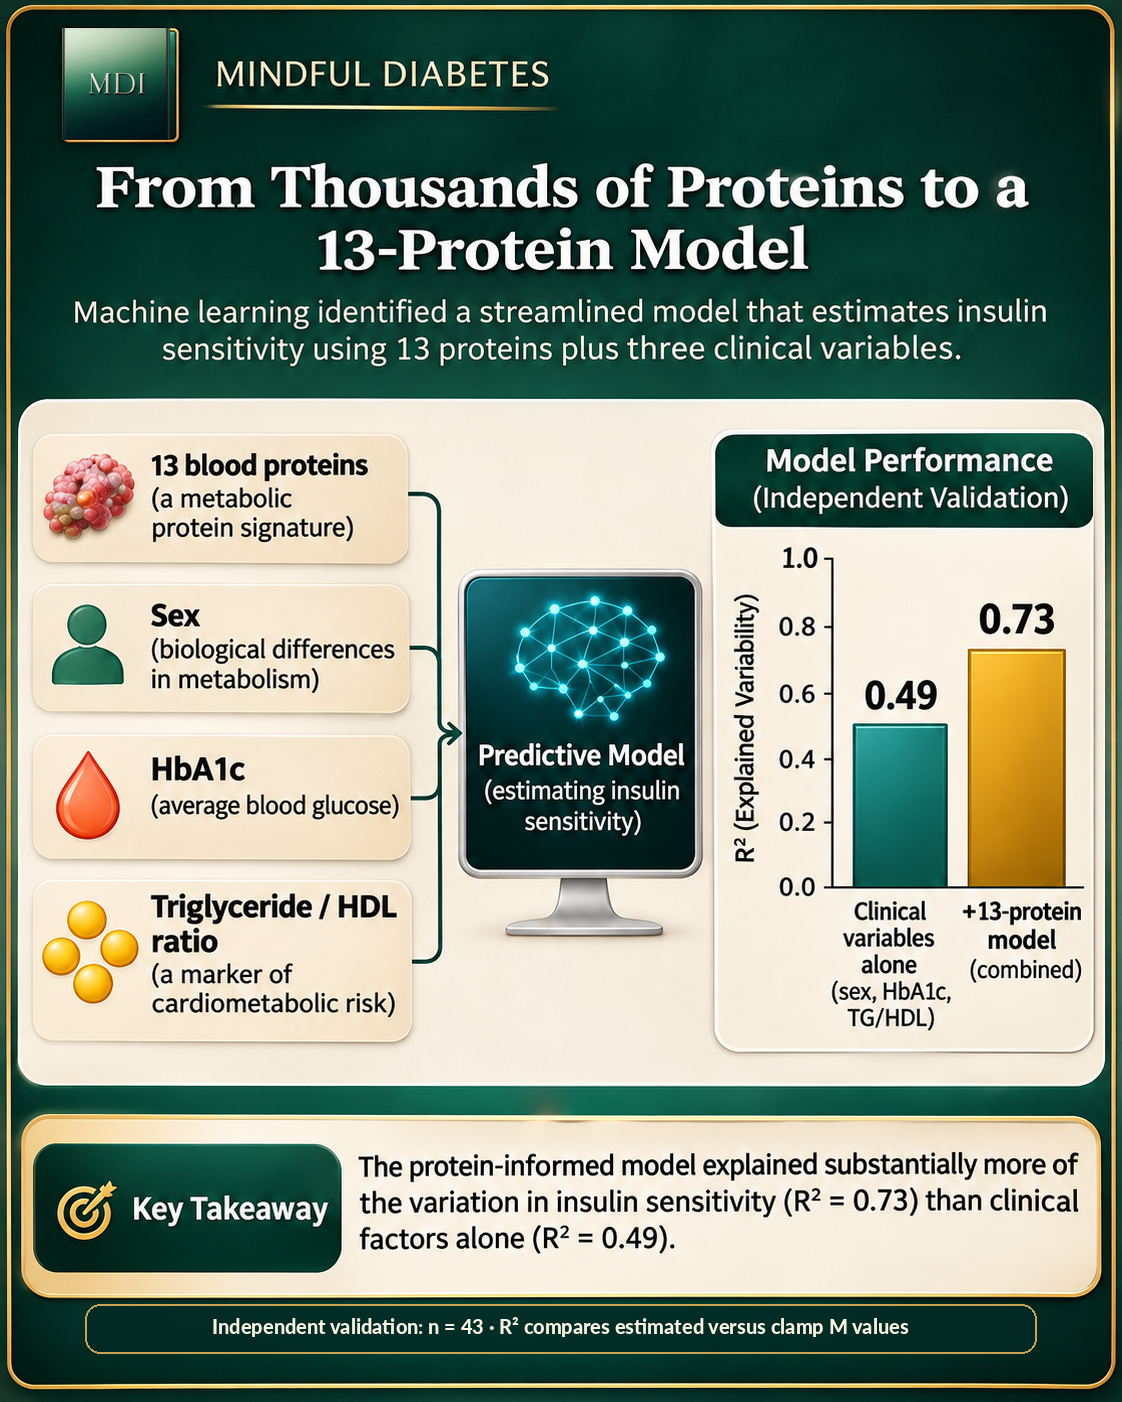
- Could a smaller panel work? A model combining 13 proteins with sex, HbA1c, and the triglyceride-to-HDL-cholesterol ratio explained more variation in independently measured insulin sensitivity than the clinical variables alone (R² = 0.73 versus 0.49 in an independent 43-person validation cohort). The model's cross-validated R² across the study cohorts was 0.67. [1]
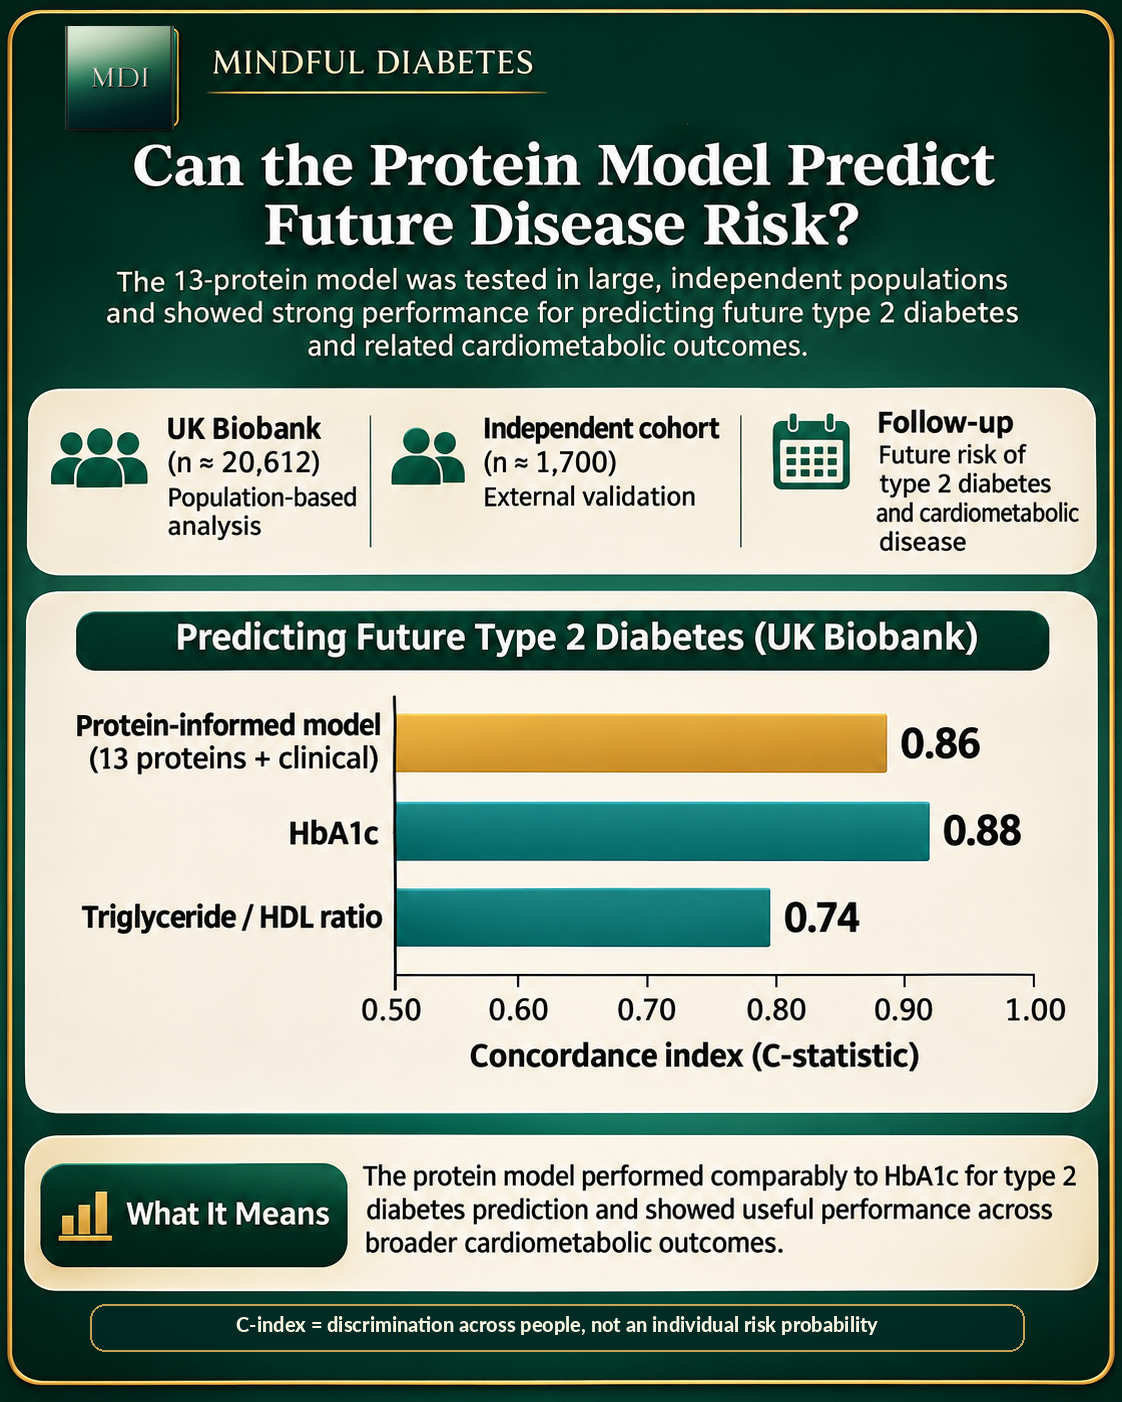
- What did the researchers test next? They applied the model to 20,612 UK Biobank participants and evaluated prospective disease risk. Its type 2 diabetes risk-discrimination result was strong (C-index 0.86) but similar to HbA1c (0.88), not better. The protein-informed score performed more strongly than HbA1c for several other cardiometabolic outcomes. [1]
- What does this mean for you today? There is not enough evidence to order a 13-protein panel or interpret individual protein levels as a personal insulin-resistance diagnosis. Existing clinical screening, individualized medical care, and sustainable behaviors still matter. [1, 2]
First, what is insulin resistance—and why isn't HbA1c the same thing?
Insulin is a hormone released by pancreatic beta cells. Among its many actions, it helps muscle and fat tissue handle nutrients, restrains glucose release from the liver, and coordinates storage and use of energy after eating. Healthy metabolism is not simply about producing insulin; it is also about how tissues respond to it.
Insulin resistance refers to a reduced biological response to insulin at a given concentration. To compensate, the pancreas may release more insulin. In some people, glucose can remain in a familiar range for a time even while the body needs a larger insulin signal to maintain it. If compensation becomes inadequate, glucose regulation can deteriorate.
This distinction matters when interpreting the measurements we commonly encounter:
| Measurement | What it tells us | What it does not directly measure |
|---|---|---|
| Fasting glucose | Blood glucose concentration after fasting | Whole-body response to insulin |
| HbA1c | A longer-term measure of glycemic exposure | Insulin sensitivity in skeletal muscle, liver, or fat |
| CGM | Repeated estimates of interstitial glucose | Insulin concentration or clamp-derived insulin sensitivity |
| HOMA-IR | A model-based estimate using fasting glucose and insulin | A direct measurement of insulin-stimulated glucose disposal |
| Euglycaemic clamp | Insulin-stimulated glucose handling under controlled laboratory conditions | Every component of liver, fat, and brain metabolism equally |
HbA1c and plasma glucose remain established clinical tools for diabetes screening and diagnosis. The American Diabetes Association's 2026 standards continue to base diagnosis on appropriate HbA1c or plasma-glucose criteria—not on research-only proteomic signatures. [2]
A related Mindful Diabetes investigation asked why closely matched meals can produce different insulin responses even when overall glucose exposure is similar. That article deals with what happens after a meal. This week's paper asks a different question: what enduring, body-wide molecular patterns might reflect how sensitive a person is to insulin? Explore Same Calories, Different Responses to see that earlier experiment. [10]
The laboratory experiment that made this study possible
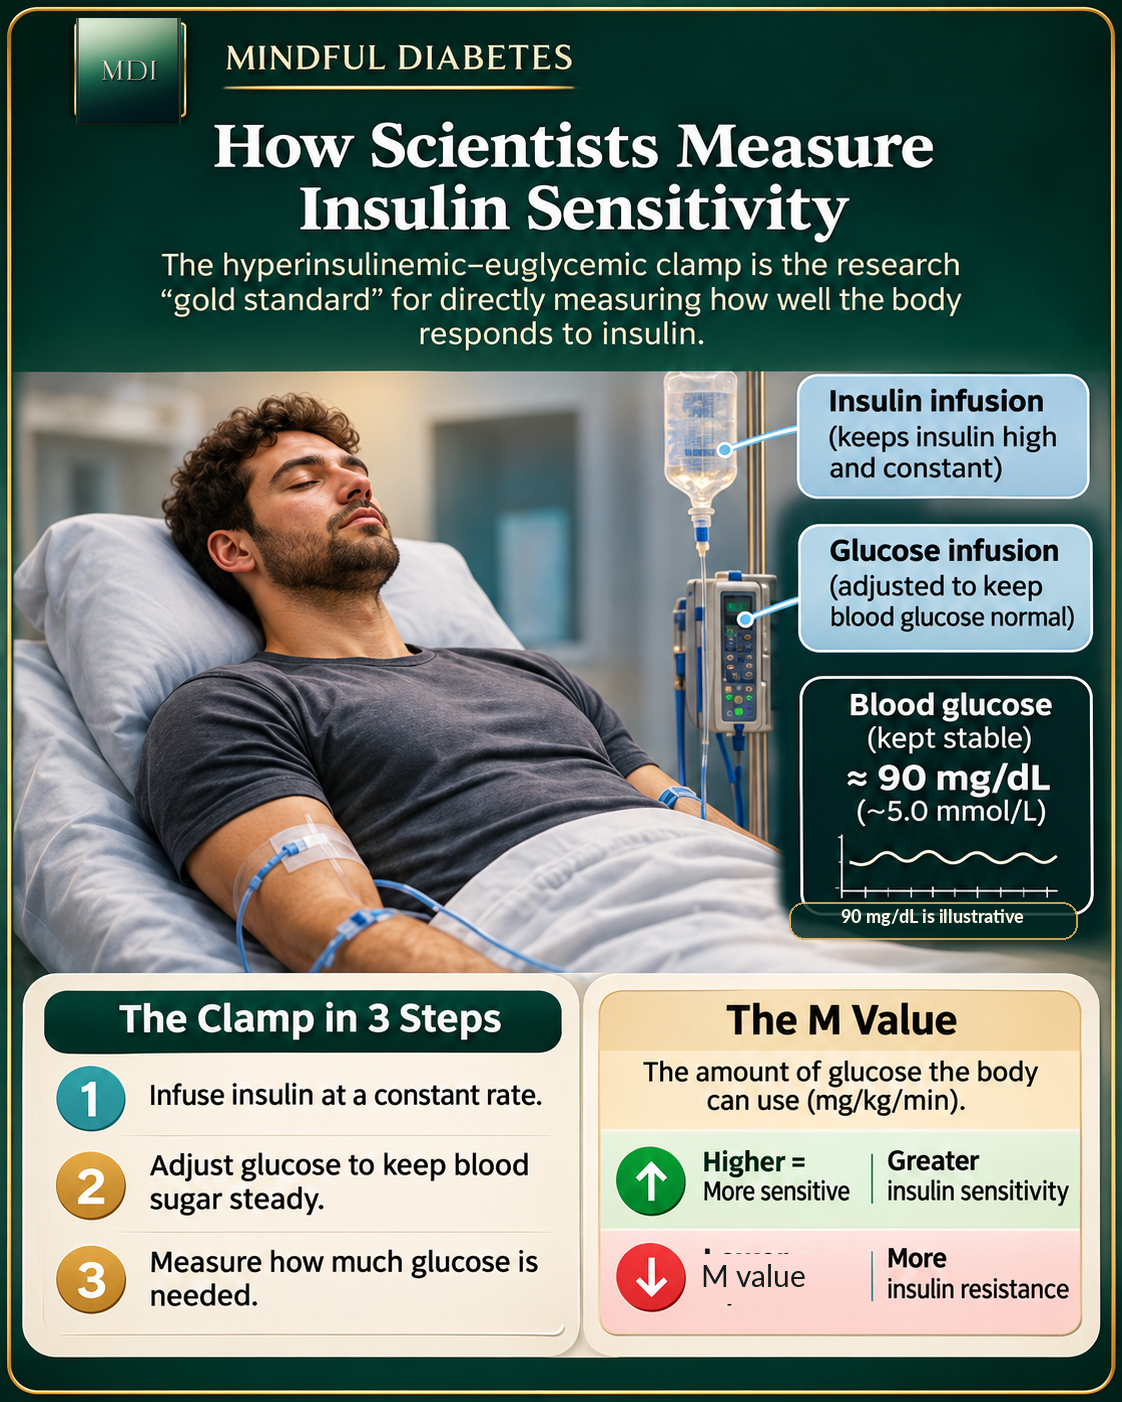
It is difficult to build a meaningful predictive model without a trustworthy measurement to learn from. Here, that measurement was the hyperinsulinaemic–euglycaemic clamp.
In the clamp, scientists infuse insulin to establish a controlled elevated insulin state. They then adjust the rate of glucose infusion to keep blood glucose near a predefined normal target. When the experiment reaches an appropriate steady state, the glucose needed to maintain that target provides an estimate of how effectively insulin stimulates glucose disposal. Depending on protocol and accompanying methods, researchers can further analyze the body's glucose handling. The technique was systematically described by DeFronzo, Tobin, and Andres in 1979. [3]
The study's M value summarizes insulin-stimulated glucose disposal. Higher values generally indicate greater whole-body insulin sensitivity under the test conditions; lower values reflect less effective disposal. The result is powerful, but the equipment, intensive monitoring, repeated sampling, and staff time make clamps impractical for screening tens of thousands of people.
That creates the central research challenge: Could blood proteins serve as a useful proxy for a difficult physiological measurement?
How do scientists measure thousands of proteins in one blood sample?
Blood plasma is the liquid component of blood, and it contains far more than sugar, salts, and familiar cholesterol-related measurements. Proteins can circulate after secretion from tissues, leakage or turnover of cells, transport in vesicles, or other biological processes. Their abundance can reflect changes in tissue physiology without revealing an exact cause on its own.
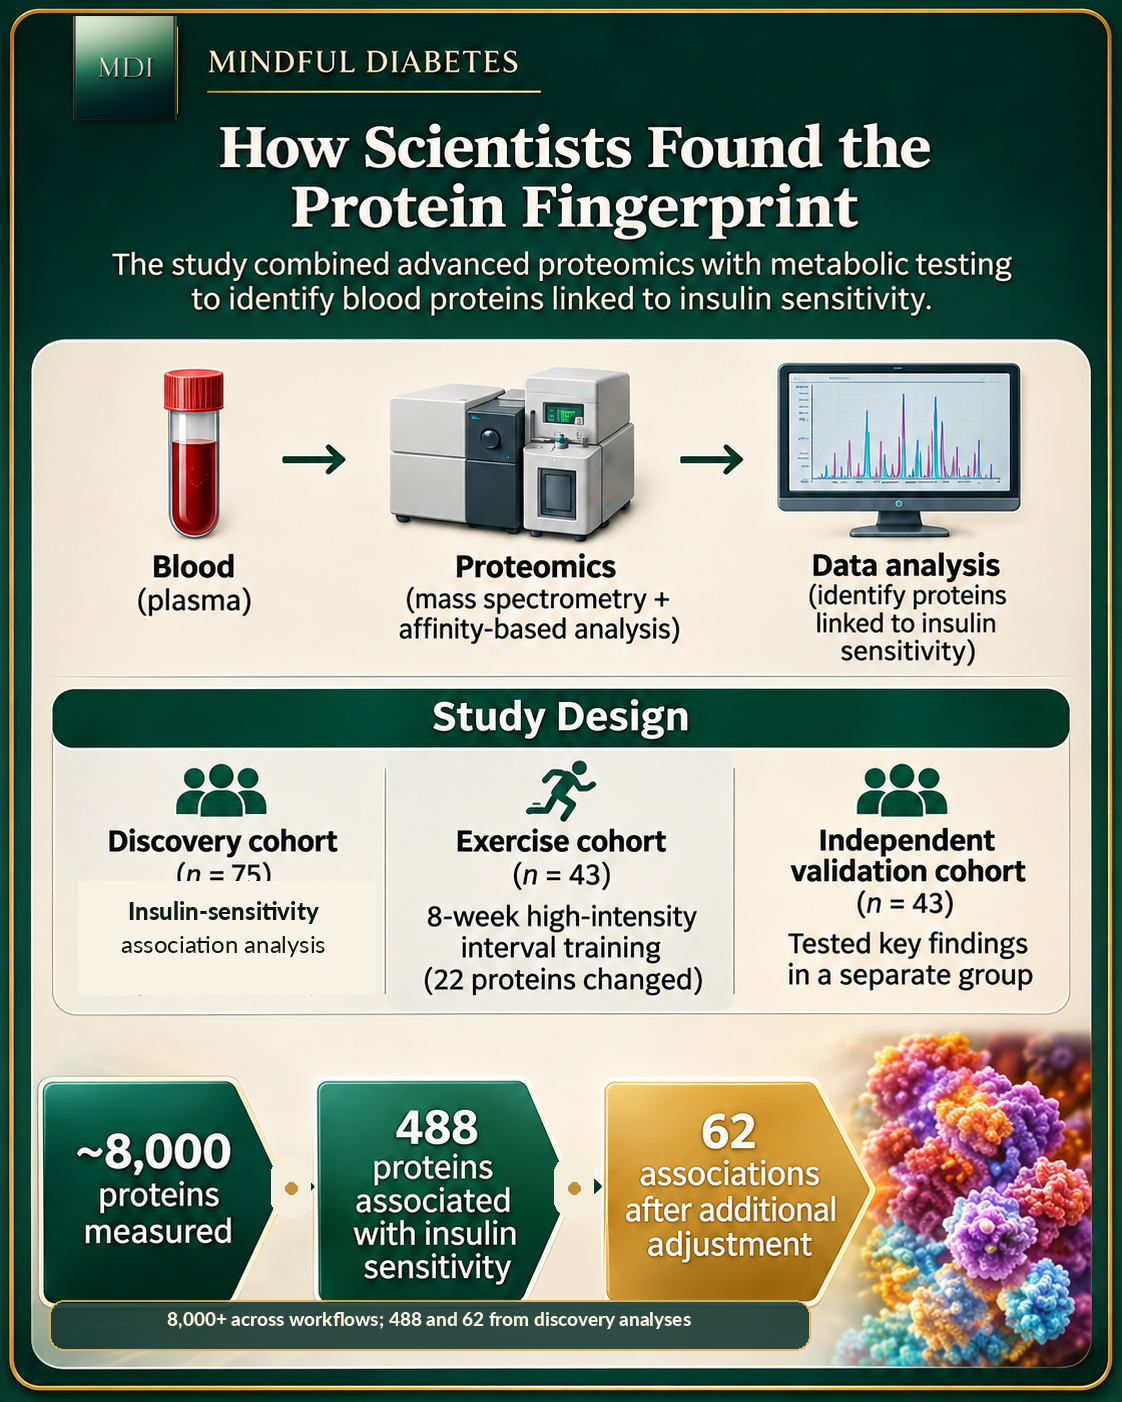
Kjærgaard and colleagues combined four mass-spectrometry-based workflows with an affinity-based proteomic platform, Olink Explore HT. Each approach sees a somewhat different subset of the plasma proteome. Together, the complementary methods identified more than 8,000 unique circulating proteins across the analyzed samples. That is considerably deeper than a routine clinical laboratory panel. [1]
The study began with 161 clamp-characterized people across three cohorts: a discovery group of 75, an exercise group of 43 men, and a separate validation group of 43. The discovery and exercise groups contributed to model development; the independent 43-person validation group tested performance in new participants. Those are distinct roles, and the much larger UK Biobank analysis came later. [1]
In the 75-person discovery cohort, the team examined the relationship between measured protein abundance and the clamp-derived M value. Initially, 488 proteins met the study's statistical threshold for association after adjustment for sex and multiple comparisons. In an additional analysis accounting for age and body fat percentage as well, 62 associations remained significant. [1]
That narrowing matters. Some associations may reflect differences in age, body composition, or other factors. Finding a statistically associated protein is also not proof that it causes insulin resistance—or that changing it would improve metabolic health.
A blood sample captures clues from multiple organs
The most interesting outcome may not be the number 488. It may be the observation that these proteins carry information associated with different tissues and physiological processes.
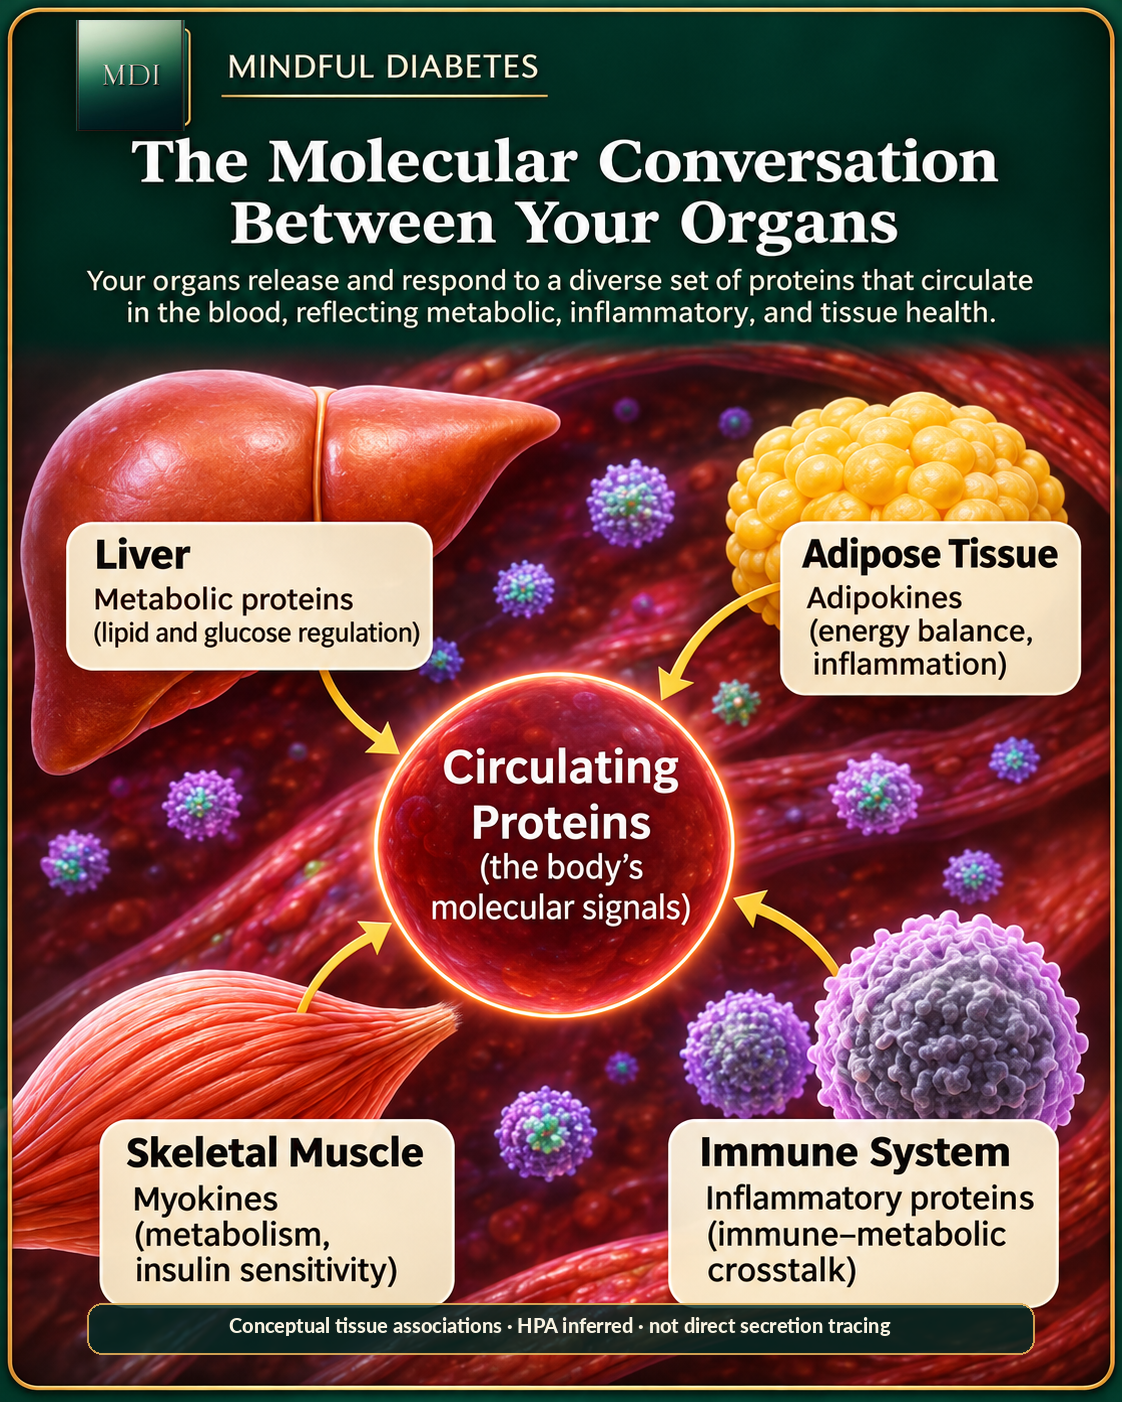
By comparing their protein lists with the Human Protein Atlas, the researchers inferred possible tissue and cell-type sources. Proteins linked to poorer insulin sensitivity were enriched for annotations associated with organs such as the liver, adipose tissue, intestine, kidney, and pancreas, and with immune-related cells. The liver showed particularly strong enrichment. [1]
But a tissue label in this analysis is not the same as tracing a protein's journey directly from an organ into a participant's blood. The researchers used reference expression data to infer likely origins. Proteins can be made in several tissues, changed after release, or vary because of differences in clearance rather than production.
The biology is nonetheless revealing:
The liver: Insulin normally helps restrain liver glucose output. The liver also manufactures circulating proteins and participates in lipid metabolism. Altered liver-linked protein patterns may therefore capture processes that fasting glucose alone does not reveal.
Skeletal muscle: Muscle is a major site of insulin-stimulated glucose disposal. During exercise, contraction can also increase glucose uptake through signaling that is partly distinct from insulin. Muscle-associated proteins may reveal aspects of this biology without directly measuring every transport event.
Adipose tissue: Fat cells store and release energy and secrete signaling molecules such as adiponectin and leptin. Adiponectin was the protein most strongly associated with insulin sensitivity in the investigators' adjusted discovery analyses. These are clues to metabolic regulation, not evidence that measuring one adipokine explains an individual's health. [1]
Immune cells: Immune activity and inflammatory pathways appeared among the associated protein patterns. That is compatible with the broader connection between immune signaling and metabolic health, while leaving open which signals cause change and which reflect it.
The team also explored why different insulin-resistance indices disagree. Fasting HOMA-IR, an index originating in the work of Matthews and colleagues, does not isolate the same physiology as a clamp-derived M value. The researchers identified protein associations that helped explain some of the discordance between adipose-linked, fasting, and clamp-based measures. [1, 4]
For a deeper look at fat tissue as a signaling organ, read How Fat Cells Store and Release Energy. It complements this investigation's tissue-wide perspective. [11]
A key discovery: the fingerprint was more than an immediate insulin reaction
There's another subtle result worth understanding. Proteins linked to insulin sensitivity were generally associated with the M value in both fasted and insulin-stimulated states, whereas many proteins whose concentrations changed during the clamp were not the same proteins associated with longer-term insulin sensitivity.
The researchers identified 491 proteins that responded significantly to the acute clamp condition, but only 34 overlapped with the insulin-sensitivity-associated set. [1]
Why is that distinction so important? A protein that changes after insulin infusion may be reacting to the experiment. A protein consistently associated with insulin sensitivity across states may be reporting something more persistent about the body's underlying metabolic condition. Neither category automatically identifies a causal mechanism, but separating them makes the findings far more informative.
The authors' results suggest that plasma proteomics can help distinguish aspects of a person's metabolic phenotype from the immediate response to a temporary stimulus.
What changed after eight weeks of exercise?
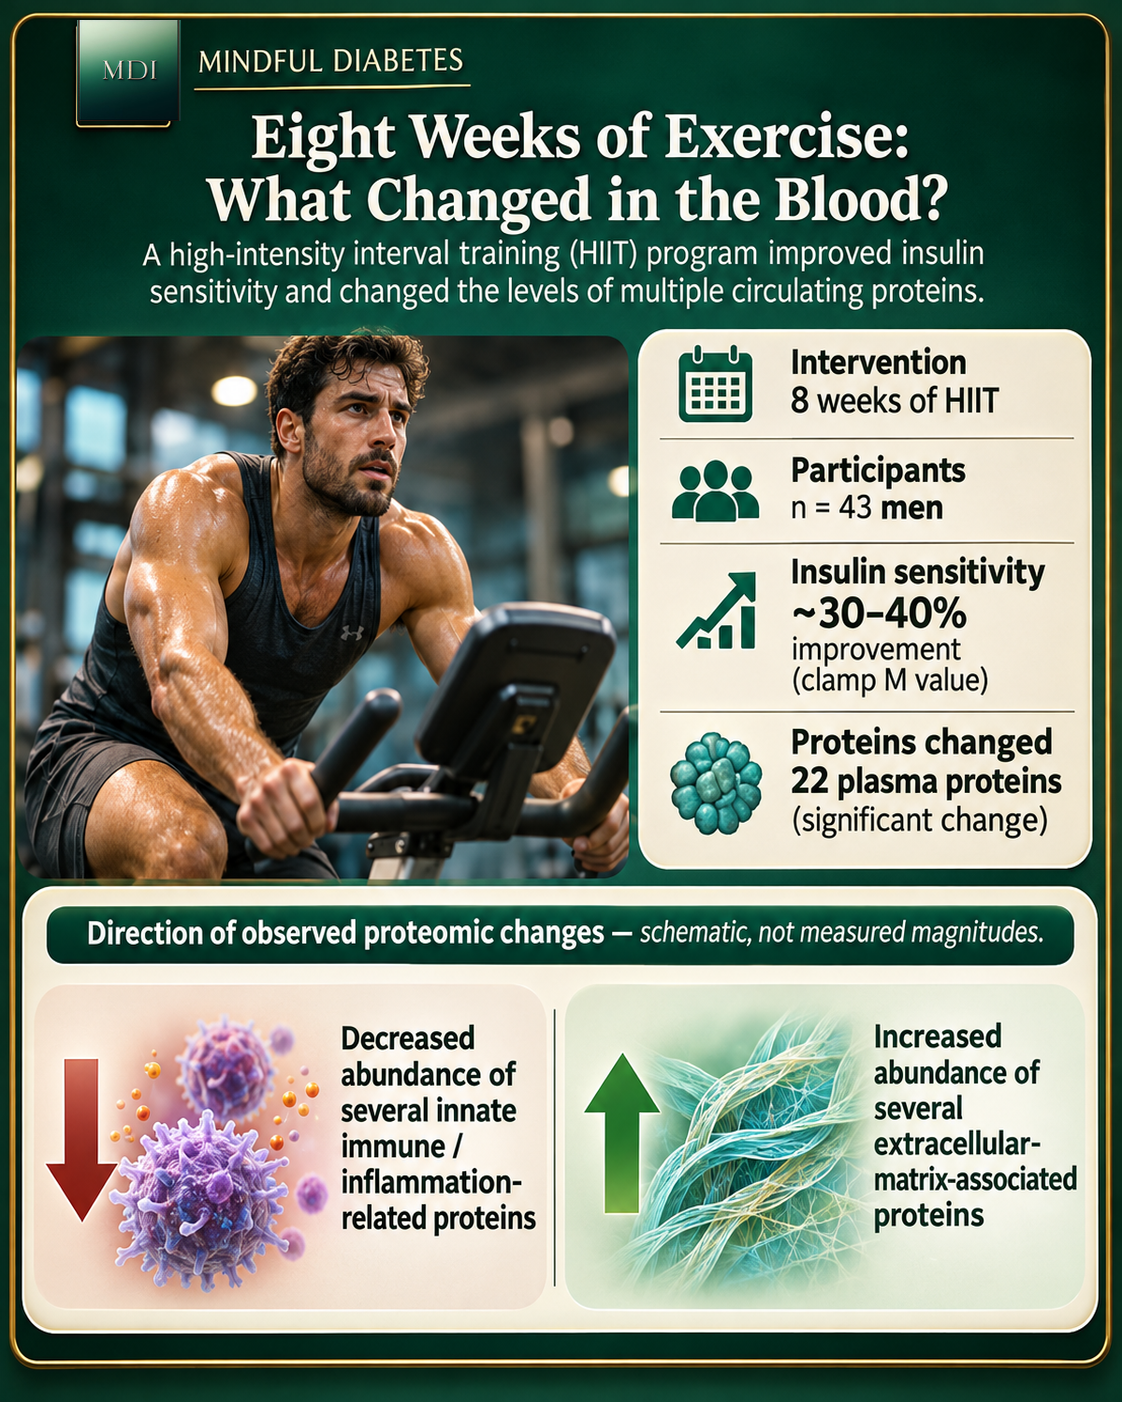
The paper did not stop at a snapshot. In a cohort of 43 men, researchers evaluated an eight-week high-intensity interval training program. Clamp-measured insulin sensitivity improved by approximately 30–40%, while aerobic capacity also improved. Twenty-two plasma proteins passed the study's significance threshold for change following training. [1]
The strongest story here is not that exercise 'fixed' 22 proteins. Protein abundance can rise or fall for many reasons, and a statistically changed protein is not necessarily the molecule responsible for a benefit.
Instead, the investigators saw a broader directional shift in insulin-sensitivity-associated proteins: lower representation of some innate-immune-related signals and higher abundance of some extracellular-matrix-associated signals. They also observed a reduction in selected liver-associated proteins. Individual proteins and subgroups responded differently. [1]
This is where two different 2026 studies tell a compelling story together. In October, Kurgan and colleagues used proteomics to study how proteins changed over hours after a single exercise session, examining blood plasma, saliva, and urine. The new November paper instead adds a longer-duration view: how a signature related to insulin sensitivity changed during eight weeks of training. These are different populations, methods, and time scales, so their protein counts are not directly comparable. [1, 5]
Our earlier Mindful Diabetes feature, Your Body Is Talking Every Time You Move, explains that October exercise atlas and why muscle activity has effects beyond calorie burning. [12]
A useful principle emerges: exercise can change metabolic physiology, and proteomics offers researchers one way to study accompanying molecular changes. It does not follow that every person needs high-intensity training, that a short intervention prevents disease, or that a commercial protein panel is required to measure progress.
How did thousands of proteins become a 13-protein model?
A model that requires eight thousand measurements is an extraordinary research tool but a complicated candidate for broad use. The investigators therefore asked whether a smaller number of proteins could help estimate the M value.
They compared statistical and machine-learning approaches, ultimately selecting a model based on least absolute shrinkage and selection operator (LASSO) regression. LASSO can shrink some candidate coefficients toward zero and retain a smaller set of predictors while balancing predictive performance and model complexity. [1]
The final combination included 13 proteins—IGFBP1, PRSS8, KRT18, CA14, FST, REN, LEP, RPL14, GDF15, LDLR, SUMF2, PON3, and SSC5D—alongside three conventional variables: sex, HbA1c, and the triglyceride-to-HDL-cholesterol ratio. [1]
Several names are worth recognizing, not because they should become individual home-test targets, but because they show the biological range of the panel:
- LEP (leptin) is associated with adipose-tissue energy signaling.
- IGFBP1 participates in the insulin-like growth factor system and is influenced by metabolic context.
- GDF15 has been studied in systemic stress responses and metabolic regulation.
- PON3 is associated with lipid-linked biology.
- LDLR participates in lipoprotein handling.
The value is in the combined information, not in treating any one protein concentration as a verdict. The model was trained to estimate a physiological quantity, not to diagnose an individual disease.
When tested in 43 independent clamp-characterized participants, the combined model achieved R² = 0.73, compared with R² = 0.49 for a model based only on clinical measurements. Across cross-validation of all 161 participants, its R² was 0.67. [1]
An R² of 0.73 indicates that the model explained a substantial portion of variation in the M value in that validation set. It does not mean the model is '73% accurate' for diagnosing insulin resistance, nor that its estimates are perfectly calibrated for every individual.
Could it predict future disease? The results are promising—and surprisingly nuanced
A predictive model is more interesting when researchers can test whether its output matters beyond the original training group. The team therefore applied the estimated insulin-sensitivity score to 20,612 UK Biobank participants and studied associations with later diagnoses. They also evaluated results in approximately 1,700 participants from the Danish Inter99 cohort, which used serum rather than plasma samples. [1]
For predicting future type 2 diabetes in UK Biobank, the protein-informed score achieved a C-index of 0.86, compared with 0.88 for HbA1c and 0.74 for the triglyceride/HDL ratio. [1]
That is not evidence that a protein panel has already beaten HbA1c as a diabetes screen. The two performed similarly for this outcome, and HbA1c was itself one of the inputs to the combined model.
The more intriguing result emerged for other conditions. For fatty liver disease, for example, the reported C-index was 0.78 for the predicted insulin-sensitivity score versus 0.58 for HbA1c in the authors' comparison. The score also showed predictive associations with other cardiometabolic conditions, including cardiovascular and renal outcomes. [1]
A C-index describes a model's ability to rank people by later event timing under a particular analysis. It is not the probability that an individual will develop disease, and performance can change across populations, follow-up methods, and clinical settings.
The study also drew on an earlier large plasma-proteome atlas of 53,026 UK Biobank adults, which had linked circulating proteins with hundreds of diseases and health-related traits. That independent underlying research helps explain why population-scale proteomics is now capable of connecting protein signatures with long-term outcomes. [6]
The research fits a bigger movement toward precision medicine
The idea that people can share a diagnostic label while having different underlying biology is not new. In 2018, Ahlqvist and colleagues used clinical variables to identify several reproducible adult-onset diabetes subgroups with different complication patterns. [7]
Large-scale protein studies have added another layer. The UK Biobank Pharma Proteomics Project profiled thousands of proteins in more than 54,000 participants, documenting relationships among proteins, genetics, and many health traits. [8] Later atlas work related those measurements to prospective health outcomes. [6]
What makes the November 2026 study distinctive is the combination of detailed physiological measurement, multiworkflow proteomics, organ-associated interpretation, an exercise intervention, and independent prediction testing in one research program. [1]
There is still a difference between identifying molecular patterns and proving that using them changes patient outcomes. A protein signature becomes clinically useful only when it can be measured reliably, interpreted appropriately, and shown to improve decisions beyond existing care.
Could you get this blood test today?
Not as an established, clinically validated 13-protein insulin-resistance test based on this publication.
Individual proteins in the study may have established research or clinical roles in other contexts. That does not mean ordering them separately reproduces the researchers' model. The panel depends on precise assays, normalization, predictive coefficients, population context, and several non-protein inputs. Its purpose was to estimate clamp-derived insulin sensitivity, not deliver a stand-alone personal diagnosis.
If you're concerned about diabetes or metabolic risk, conversations with a clinician can start with established assessments such as HbA1c and fasting plasma glucose, with additional testing when appropriate. The American Diabetes Association's 2026 standards describe the roles and limitations of these tests. [2]
More broadly, there is already strong randomized-trial evidence that interventions can meaningfully reduce progression to type 2 diabetes in selected high-risk populations. In the landmark Diabetes Prevention Program, an intensive lifestyle intervention reduced diabetes incidence by 58% relative to placebo over an average 2.8-year follow-up, and metformin reduced incidence by 31%. That trial was not a trial of proteomic-guided care, but it reminds us that new biomarkers do not replace the importance of proven approaches. [9]
For readers looking for flexible, practical food choices rather than a molecular score, our DASH diet guide reviews the evidence for a food pattern that supports blood-pressure health and can be adapted to diabetes management. [13]
What the study cannot yet tell us
The authors explicitly note that the clamp-characterized cohorts were relatively small and included predominantly European-ancestry participants. The training intervention involved men, limiting how confidently we can generalize its protein changes. The tissue-of-origin mapping relied on reference gene-expression data, not direct measurement of which organ released each circulating protein. Medication histories were not systematically assessed as potential influences on the proteome. [1]
There are also important translation questions: Can the same exact panel be measured consistently by multiple clinical laboratories? Do predictions remain stable over years? Does it add information beyond standard risk calculators in diverse populations? Does testing it change patient decisions or health outcomes? And are the benefits worth the cost and complexity?
Those are the studies that would move an exciting molecular insight toward routine care. The current evidence supports the biology and research value of the signature; it does not yet establish the clinical utility of offering this panel to everyone.
A practical way to use the insight: look at patterns, not a perfect score
The central lesson is that metabolic health is distributed across tissues and time. No one measurement—glucose, HbA1c, body weight, a lipid ratio, or a protein score—captures everything.
For everyday life, that points toward a sensible division of labor. Let clinical tests and individualized medical advice handle disease assessment. Use behavior tracking to notice habits you can actually change: regular movement, sleep, meal patterns, hydration, and recovery. If you already track glucose, interpret repeated patterns with the broader context rather than treating a single number as your entire metabolism.
Memovela can help organize those daily routines and reflect on patterns. It does not measure circulating proteins, estimate clamp M values, or diagnose insulin resistance. Our article Why the Same Meal Can Affect Your Body Differently Every Day provides a companion perspective on why one glucose observation is not a complete explanation. [14]
If you enjoy the deeper biology, Your Body Is Talking Every Time You Move and How Fat Cells Store and Release Energy explore two of the organ-level stories that make this week's protein findings so compelling. [11, 12]
The bigger picture: a blood sample is not a crystal ball
The best part of this research isn't the idea that a future doctor might be able to order thirteen more blood measurements. It's the possibility of asking better questions about the biology of insulin resistance.
Why do two people with similar glucose measurements have different responses to insulin? How do liver, muscle, fat, and immune pathways contribute to that difference? Which proteins change when physiology improves? And which molecular signatures predict something useful enough to guide future care?
Kjærgaard and colleagues have given researchers a more detailed map, with a striking amount of information hidden in ordinary-looking plasma. The map is not the territory—and it is not yet a routine medical test. But it helps explain why the future of metabolic medicine may involve understanding patterns across the body, rather than chasing one supposedly perfect number.
That is science worth following.
Key takeaways
- Insulin sensitivity and blood glucose are related but different measurements.
- The new study linked 488 circulating proteins to clamp-measured insulin sensitivity, with 62 remaining significant after broader adjustment.
- An eight-week exercise intervention changed a subset of proteins and improved insulin sensitivity in 43 men.
- A 13-protein-plus-clinical model improved the estimation of insulin sensitivity compared with clinical predictors alone in independent validation.
- Population-scale findings are promising for research, but this is not yet an established diagnostic blood test or proof that protein-guided decisions improve health outcomes.
Medical note: This article provides science education, not individualized diagnosis or treatment. Do not order or interpret isolated research proteins, change medications, or start high-intensity training based on these findings alone. Discuss metabolic risk assessment and activity plans with your healthcare team, particularly if you have diabetes, are pregnant, have cardiovascular symptoms, or use medicines that may cause hypoglycemia.
Scientific sources
- Kjærgaard J, Kurgan N, Gräf JF, et al. Plasma proteomics identifies insulin resistance signatures predictive of cardiometabolic disease risk. Nature Metabolism. Published November 16, 2026. DOI: 10.1038/s42255-026-01662-1. Primary study.
- American Diabetes Association Professional Practice Committee. Diagnosis and Classification of Diabetes: Standards of Care in Diabetes—2026. Diabetes Care. 2026. 2026 clinical standards.
- DeFronzo RA, Tobin JD, Andres R. Glucose clamp technique: a method for quantifying insulin secretion and resistance. American Journal of Physiology. 1979;237:E214–E223. DOI: 10.1152/ajpendo.1979.237.3.E214. Original method study.
- Matthews DR, Hosker JP, Rudenski AS, et al. Homeostasis model assessment: insulin resistance and beta-cell function from fasting plasma glucose and insulin concentrations in man. Diabetologia. 1985;28:412–419. DOI: 10.1007/BF00280883. Original model study.
- Kurgan N, Kjærgaard J, Jespersen NZ, et al. Systemic proteomic dynamics of acute exercise reveal genetic links to health and disease. Nature Metabolism. Published October 12, 2026. DOI: 10.1038/s42255-026-01621-w. Primary research.
- Deng YT, et al. Atlas of the plasma proteome in health and disease in 53,026 adults. Cell. 2024. DOI: 10.1016/j.cell.2024.10.045. Primary cohort study.
- Ahlqvist E, Storm P, Käräjämäki A, et al. Novel subgroups of adult-onset diabetes and their association with outcomes: a data-driven cluster analysis of six variables. Lancet Diabetes & Endocrinology. 2018;6:361–369. DOI: 10.1016/S2213-8587(18)30051-2. Primary research.
- Sun BB, et al. Plasma proteomic associations with genetics and health in the UK Biobank. Nature. 2023;622:329–338. DOI: 10.1038/s41586-023-06592-6. Primary research.
- Diabetes Prevention Program Research Group. Reduction in the Incidence of Type 2 Diabetes with Lifestyle Intervention or Metformin. New England Journal of Medicine. 2002;346:393–403. DOI: 10.1056/NEJMoa012512. Randomized clinical trial.